
- Feed Preview Visualization – Free and Open Source GIS Ramblings
Trajectools update: stop detection & trajectory styling
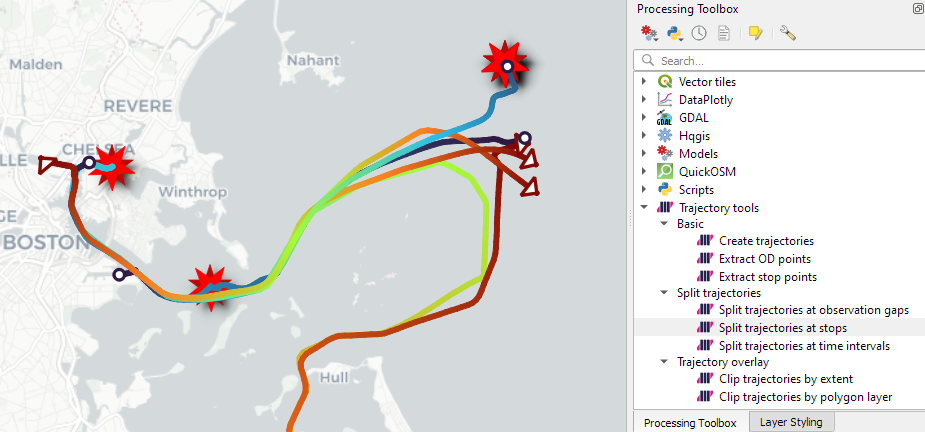
The Trajectools toolbox has continued growing: I’m continuously testing the algorithms integrated so far to see if they work as GIS users would expect and can to ensure that they can be integra...
https://anitagraser.com/2024/01/27/trajectools-update-stop-detection-trajectory-styling/
Mapping Neo4j spatial nodes with GeoPandas
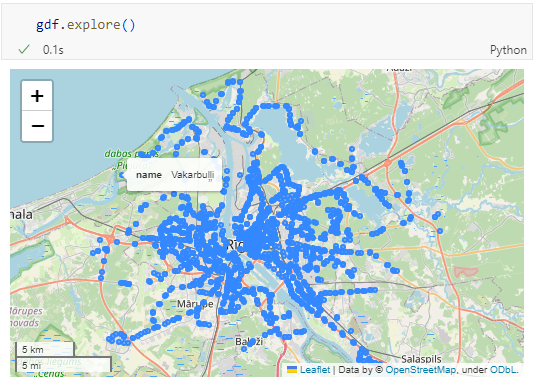
In the recent post Setting up a graph db using GTFS data & Neo4J, we noted that — unfortunately — Neomap is not an option to visualize spatial nodes anymore. GeoPandas to the rescue! But firs...
https://anitagraser.com/2023/12/03/mapping-neo4j-spatial-nodes-with-geopandas/
Setting up a graph db using GTFS data & Neo4J
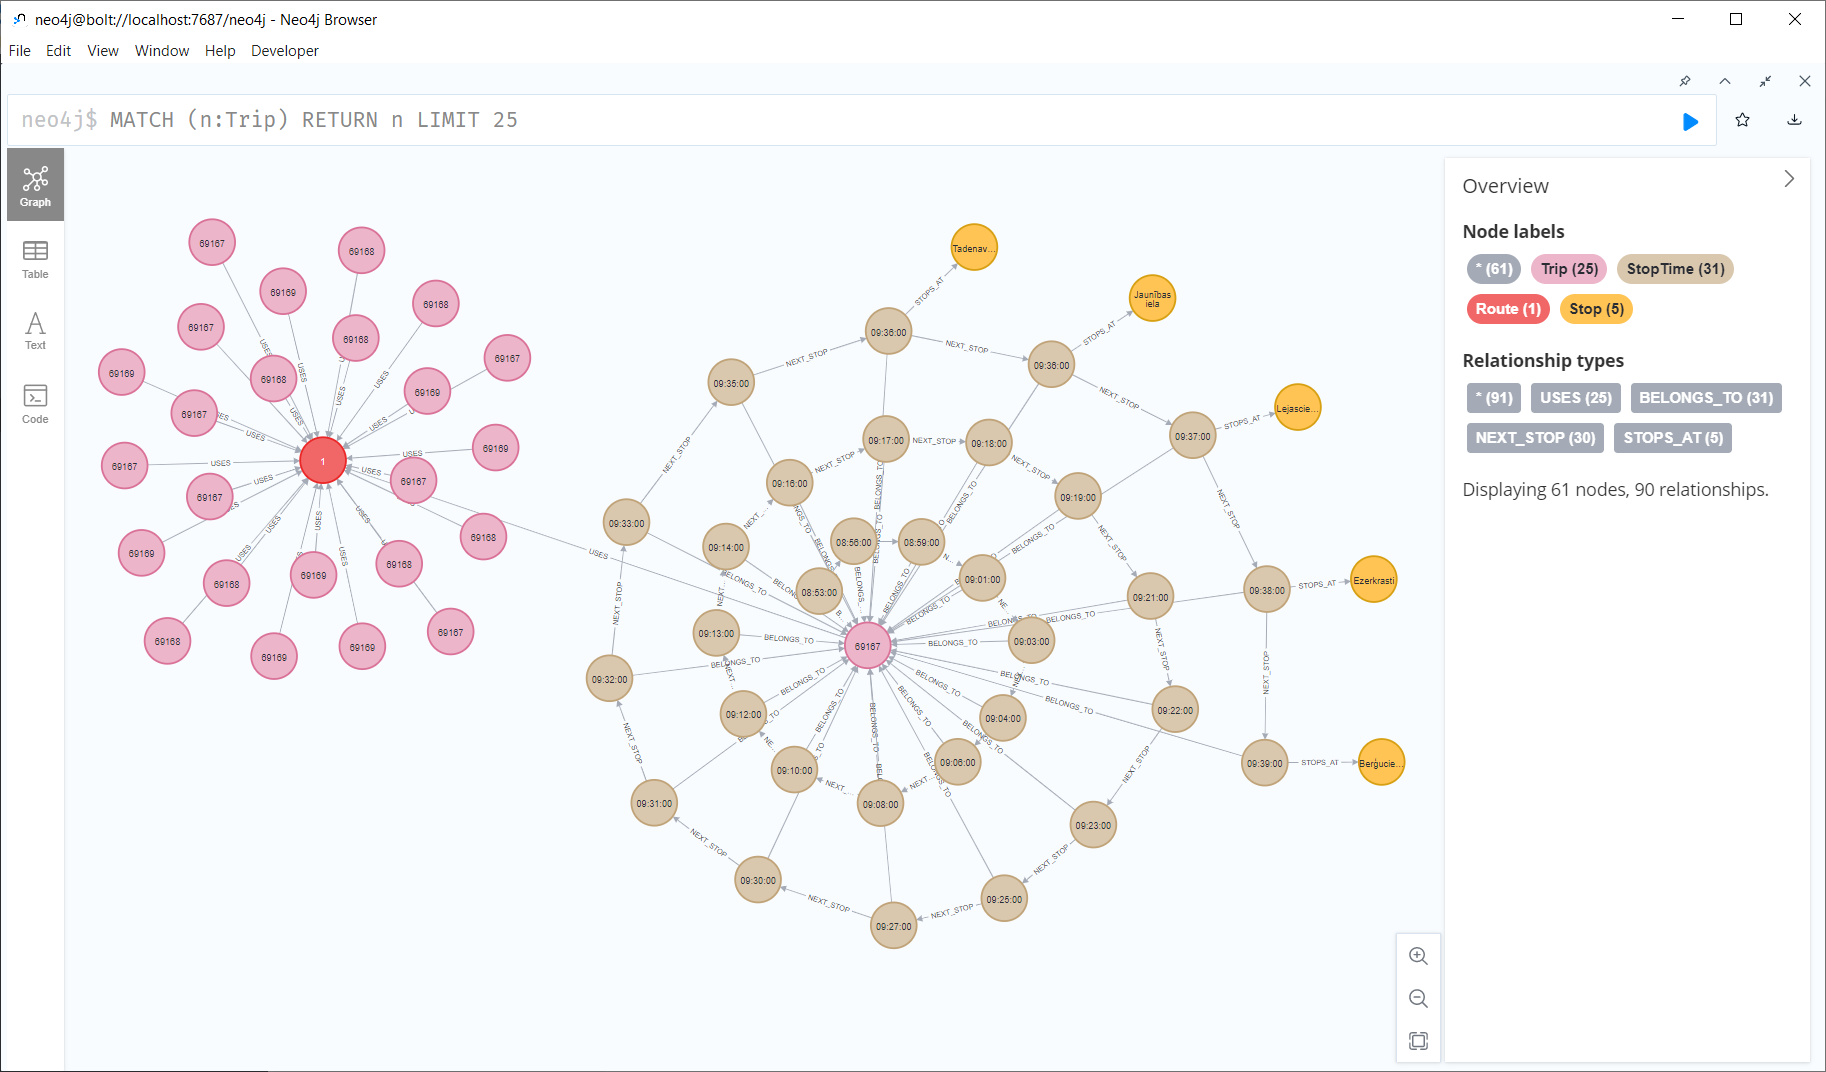
In a recent post, we looked into a graph-based model for maritime mobility data and how it may be represented in Neo4J. Today, I want to look into another type of mobility data: public transport ...
https://anitagraser.com/2023/11/27/setting-up-a-graph-db-using-gtfs-data-neo4j/
Analyzing video-based bicycle trajectories
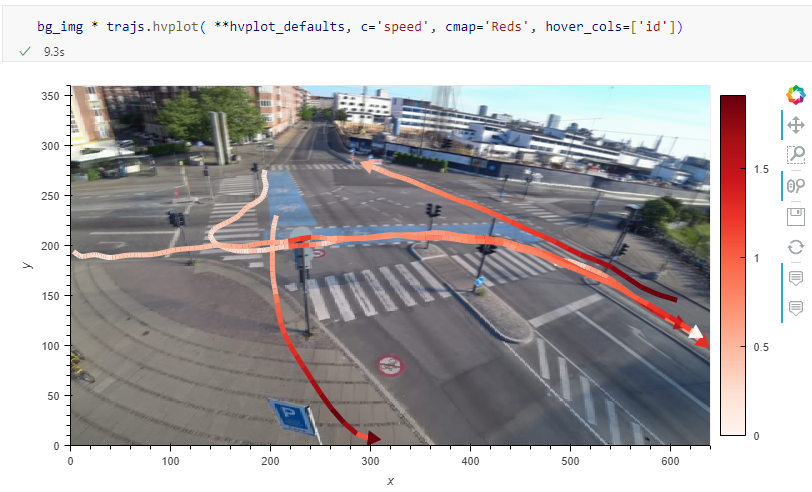
Did you know that MovingPandas also supports local image coordinates? Indeed, it does. In today’s post, we will explore how we can use this feature to analyze bicycle tracks extracted from vide...
https://anitagraser.com/2023/05/21/analyzing-video-based-bicycle-trajectories/
Forget label buffers! Better maps with selective label masks in QGIS
Cartographers use all kind of tricks to make their maps look deceptively simple. Yet, anyone who has ever tried to reproduce a cartographer’s design using only automatic GIS styling and labelin...