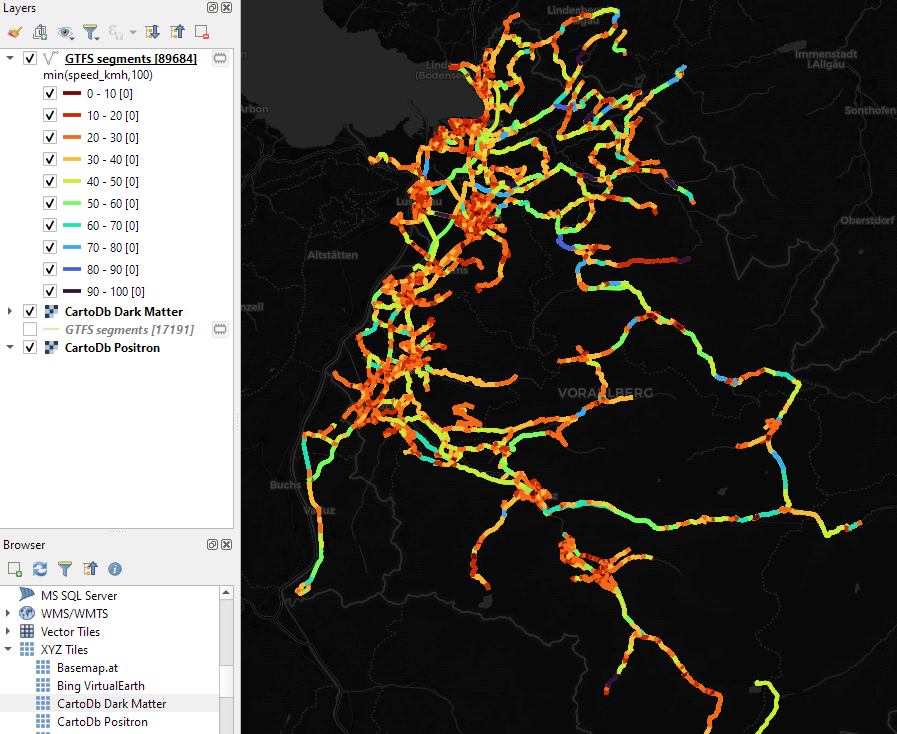
Trajectools continues growing. Lately, we have started expanding towards public transport analysis. The algorithms available through the current Trajectools development version are courtesy of th...
https://anitagraser.com/2024/05/04/gtfs-algorithms-about-to-land-in-trajectools/
Previously, we mapped neo4j spatial nodes. This time, we want to take it one step further and map relationships. A prime example, are the relationships between GTFS StopTime and Trip nodes. For e...
https://anitagraser.com/2023/12/09/mapping-relationships-between-neo4j-spatial-nodes-with-geopandas/
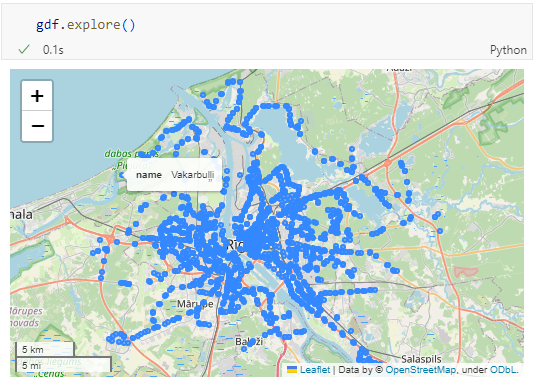
In the recent post Setting up a graph db using GTFS data & Neo4J, we noted that — unfortunately — Neomap is not an option to visualize spatial nodes anymore. GeoPandas to the rescue! But firs...
https://anitagraser.com/2023/12/03/mapping-neo4j-spatial-nodes-with-geopandas/
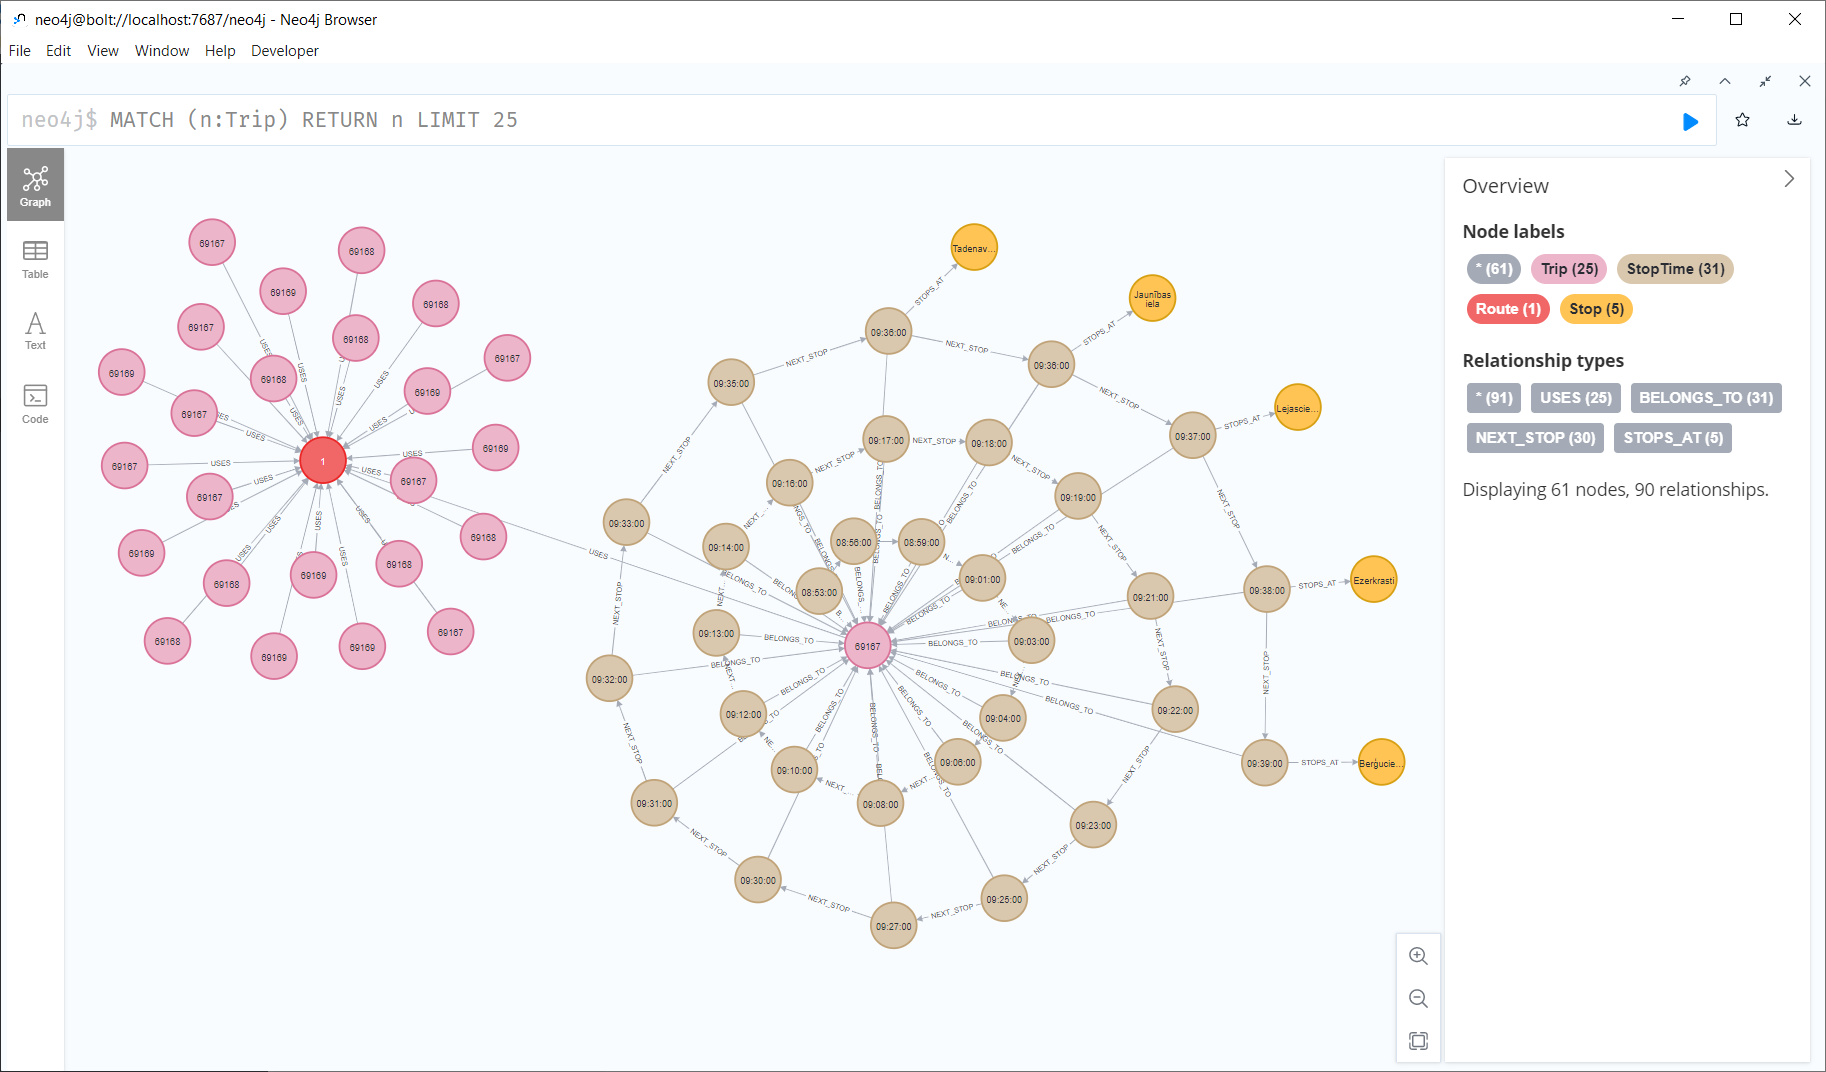
In a recent post, we looked into a graph-based model for maritime mobility data and how it may be represented in Neo4J. Today, I want to look into another type of mobility data: public transport ...
https://anitagraser.com/2023/11/27/setting-up-a-graph-db-using-gtfs-data-neo4j/
This guide provides step-by-step instructions to produce drive-time isochrones using a single vector shapefile. The method described here involves building a routing network using a single vector...
How do you objectively define and compute which parts of a network are in the center? One approach is to use the concept of centrality. Centrality refers to indicators which identify the most imp...
https://anitagraser.com/2015/03/07/computing-network-centers/
“The Morphing City” by Pedro M Cruz is a visualization of deviations of traffic velocities in the city of Lisbon: The Morphing City from Pedro M Cruz on Vimeo. Very inspiring!
https://anitagraser.com/2011/03/25/visualizing-traffic-velocities-in-a-network/
I just stumbled upon this interesting piece of code for visualization of network flow on gis.stackexchange.com: It’s called “Flow Map Layout” and was developed at Standford University (proj...
https://anitagraser.com/2010/09/16/visualizing-networks-flow-map-layout/